A scatter plot can show which observations look alike. It cannot, by itself, show which observation came first. This distinction is the starting point of trajectory machine learning.
Consider two conversations with the same sentence: “Fine, I trust you.” One follows a sincere apology; the other follows a threat. The visible sentence is similar, but the relationship state and likely next action differ. A cell has a related measurement problem: thousands of gene-expression values are visible, while its developmental state is an interpretation inferred from those measurements. Neither domain hands us the state directly.
This course asks one question repeatedly: what information allows us to infer state, paths, movement, and eventual outcomes from observations? The algorithms will change; this question will remain.
Before class and the 90-minute plan
You need Python arrays, vectors, averages, and basic probability. No biology background is assumed. Spend 15 minutes on the motivating examples, 20 on the observation model, 20 on the synthetic experiment, 20 running the lab, and 15 discussing claims and limitations. After class you should distinguish a coordinate, an ordering, a velocity, and an outcome prediction.
Set up the environment using the course resources. Download the complete lab bundle; lesson01.py uses the shared common.py in that bundle. All examples are synthetic, require no account, and download no data.
One observation, many hidden explanations
Write an observation as $x\in\mathbb R^D$. A feature could be a normalized gene count, a conversation embedding coordinate, or a measured dialogue attribute. We hypothesize a smaller state $z\in\mathbb R^d$ with $d\ll D$:
$$ x=g(z)+\epsilon. $$Here $g$ maps a state to observable features and $\epsilon$ represents measurement noise and unmodeled variation. In our project there are 24 measured features and two generator coordinates. Real expression measurements can contain around 20,000 genes; the number does not imply that all genes vary independently.
The equation is an assumption, not a proof that a uniquely correct state exists. If an invertible transformation $h$ changes the coordinates, then $z'=h(z)$ and $g'=g\circ h^{-1}$ produce identical observations. Even perfect reconstruction therefore need not recover named concepts such as “trust” or “maturity.” More structure or external measurements are needed to give coordinates that interpretation. This identifiability issue becomes especially important for learned representations; see Locatello et al.’s analysis of unsupervised disentanglement.
For a two-dimensional toy, imagine a horizontal progress coordinate and a vertical branch coordinate. Points first advance together and later split upward or downward. We use those coordinates to generate 24 mixed, nonlinear, noisy measurements. A learning algorithm receives those measurements. It does not receive the answer coordinates.
Five different questions
Our working chain is
$$ \boxed{x\rightarrow z\rightarrow\text{trajectory}\rightarrow\text{dynamics}\rightarrow\text{fate}}. $$Each arrow introduces a new claim. Representation asks what information the state retains. Geometry asks which states are nearby. Trajectory inference asks how those states might connect and branch. Dynamics asks how a state changes over a specified interval. Fate prediction asks which endpoint is likely, given information available now.
Suppose a point cloud forms a Y. The shape supports a branching description. It does not establish whether one population split into two, two populations merged into one, or several unrelated processes happened to occupy that shape. A root label, collection time, longitudinal observations, lineage tracing, or another directional measurement can supply additional evidence. We must say which evidence we use.
A pseudotime is an inferred ordering along a proposed path. Calendar time is a measured clock. A path can contain many observations because movement is slow, sampling is intense, or proliferation is high. Density alone cannot distinguish those explanations. We will revisit this ambiguity when comparing trajectories with population transport.
The same project for twelve lessons
The generator creates 120 sessions, each with 16 ordered steps. A row is one observation; a session is one connected sequence. X holds measured features. time, session, and next_index record observational structure. branch and z_true are simulator answers reserved for explicit evaluation or labeled oracle illustrations.
Later lessons also use session-level outcomes and randomized treatment. Those columns are not secretly appended to X. The baseline is measured before treatment. Keeping these roles separate prevents a future outcome from leaking into a current-state prediction.
Our split holds out entire sessions. If neighboring steps from the same session were randomly spread across train and test, the model could see almost the same sequence during training and appear to generalize better than it does. Real conversation projects may require user-level or character-level grouping; cell studies may require donor-level splits. The split should match the new unit on which you intend to deploy. scikit-learn’s grouped cross-validation documentation describes the corresponding splitters.
Run the first audit
Run this excerpt from the extracted lab directory:
from pathlib import Path
from lesson01 import run

metrics = run(Path("outputs"))
print(metrics)
The full script fits preprocessing and PCA on training sessions, transforms all observations, and plots one held-out sequence in its recorded order. It also checks that session IDs never overlap between splits, every valid next step remains within its session, and timestamps increase along recorded transitions. These are data-contract checks, not claims that PCA recovered biology.
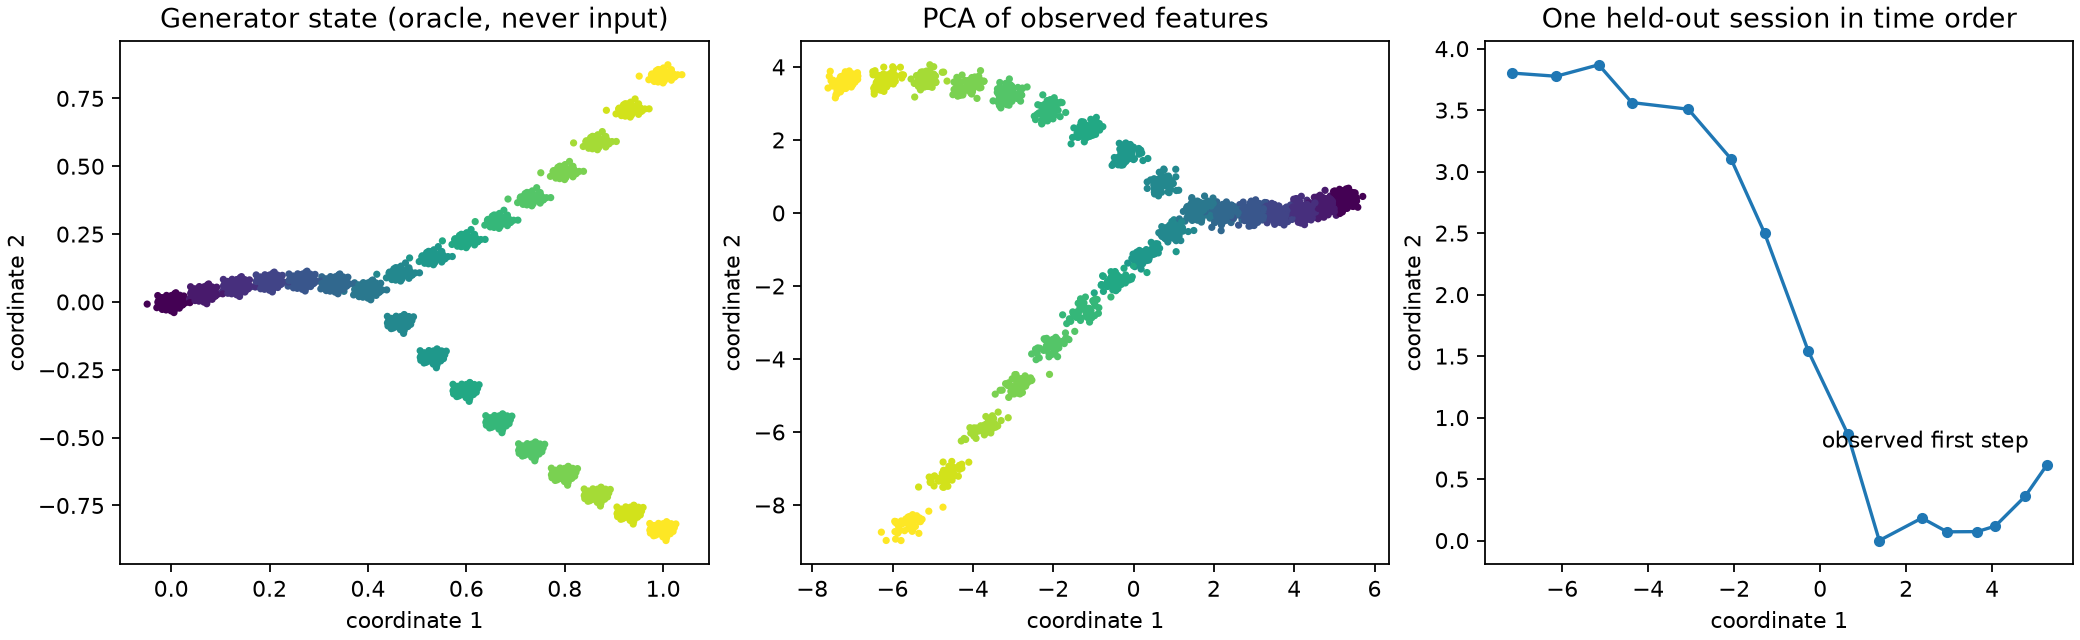
The first panel deliberately shows z_true and labels it as an oracle. The second uses learned coordinates. Their axes need not match, even when both reveal useful structure. Color indicates recorded time only for inspection; time was not used to fit PCA. The third panel uses ordering information unavailable in an unordered snapshot.
The audit also permutes rows and compares the feature centroid. Apart from floating-point roundoff, the mean is unchanged. More generally, a set-based representation of the same points is unchanged by row order. Reversing the chronological interpretation would not change that set either. This is a small executable demonstration of why snapshots do not determine direction.
How the two domains differ
For cells, many assays destroy the measured cell. Observations at successive collection times therefore often describe different cells. Linking them requires population assumptions or additional lineage information. “Cell A becomes cell B” is stronger than “these cells lie on a plausible developmental continuum.”
For character conversations, ordered turns are often available, but a turn is not a fixed duration. Twenty short turns and twenty long turns can represent different elapsed times and different amounts of narrative progress. A context window also creates overlap between neighboring observations. Define the unit, window, and clock before fitting a transition model.
These examples share mathematical tools, not identical measurement processes. A dialogue difference is not RNA velocity; a cell cluster is not automatically a character intent. The useful transfer is the habit of stating what is observed and what is inferred.
Exercises and discussion
- Reverse a session. Draw its points in reverse order without changing the point set. What changed? Answer: the directed transitions change; the centroid and undirected geometry do not. A snapshot-only estimator cannot choose between the two directions without assumptions.
- Audit an input column. May a “final session length” column enter a predictor at turn three? Answer: generally no. It contains future information unavailable at that turn. A current elapsed-turn count is different, though it can still encode censoring or collection conventions.
- Name the deployment target. Would a session-level split establish generalization to unseen users? Hint: one user may produce several sessions. Hold out users to evaluate that claim and report how characters are shared across splits.
The project deliverable is one figure and a short claim ledger: what the plot directly shows, what you inferred, and which additional measurement would test that inference. Next, PCA will give us a mathematically precise first state representation.